One of the focus areas for the HIRRT laboratory while it was based at Purdue was the development of new tools to diagnose and treat tumors. Much of this work has been performed in collaboration with Professors Gore, Raman, and Savran, also in the School of Mechanical Engineering, but our efforts are expanding to include biologists, clinicians, and biochemists. Our three primary areas include (1) the effects of the microenvironment on tumor cell metabolism, (2) computational modeling to improve drug delivery to tumors, and (3) sensitivity analysis and modeling of drug efficacy.
Effects of the Microenvironment on Tumor Cell Metabolism
Our initial interest in cancer cell biology was stimulated by the realization that our work on the microenvironment and stem cell differentiation could be used to better understand the effects of factors such as oxygen availability, glucose concentration, extracellular matrix, and temperature on tumor cell metabolism. In collaboration with Professor Gore, we have been developing a range of tools to quantify changes in cell metabolism in real time using live cell microscopy.
In particular, we have developed a High Speed Fluorescence Microscope System to quantify the NADPH activity of normal breast tissue cells and breast tumor-derived cells using live-cell imaging in order to better understand the effects of environmental stimuli on cell metabolism (Fig. 1). The system utilizes a Zeiss confocal microscope coupled with an high sensitivity camera (quantum efficiency > 90%). These data will be used by a team of mechanical engineers, clinicians, and biologists to refine heat transfer models for breast cancer detection as well as evaluating the short-term and long-term effects of drug treatments on tumor cells.
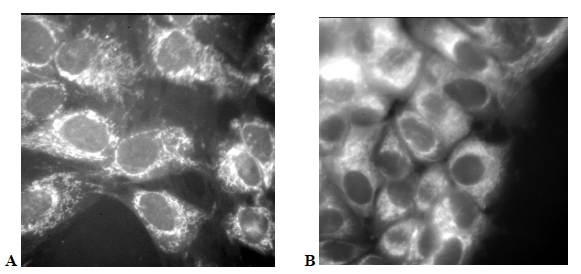
Figure 1: NADPH autofluorescence of normal human breast epithelial cells (A) and human breast cancer cells (B). The intensity of the light correlates directly with cellular level metabolic activity and indicates that the cancerous cells have a much higher metabolic activity per cell. The High Speed Fluorescence Microscope System allows us to quantitatively evaluate changes in cell metabolism in response to temperature changes, reduced oxygen availability, and drug treatments. Using these baseline data, we hope to develop cheap, effective methods to improve the efficacy of breast cancer screenings.
Computational Modeling to Improve Drug Delivery to Tumors
As part of our collaboration with Professor Gore, we began exploring methods for quantifying cell metabolism and heat transfer in tumors. The original goal was to develop a model that would allow us to use thermal imaging as a conjugate method for diagnosing tumors. Towards that end we realized that quantifying cell metabolism would require a model of the microvasculature. Very quickly we realized that this microvasculature model was useful in and of itself because the mixture theory that we used to model the capillaries and surrounding tissue was a natural way to explore drug and nanoparticle transport (Fig. 2).

Figure 2: Relative size of the pores in normal and cancerous tissue compared to nanoparticles, common drugs and other biophysical structures of interest. Dicloxacillin, 5-fluorouracil, doxorubicin, and docetaxel are common chemotherapy drugs. Abraxane is paclitaxel, a chemotherapy drug conjugated with albumin. Amoxicillin is semi-synthetic penicillin. Molecular weights are given under the common drugs.
Our group has developed a general mixture theory model that describes the transient distribution of fluid and any number of solute species, including both small molecules and macromolecules, within the microvessel, vessel wall, and interstitial space (Fig. 3) that allows for the application of an external body force such as magnetic field gradient, binding and uptake of solutes by cells, aggregation of the solutes, and solid deformation. Although largely motivated by application to nanoparticle transport, the mathematical model in its general form may be applied to any solutes in the blood including bioactive molecules, nanoparticles, therapeutic drugs, plasma proteins, glucose, and oxygen.
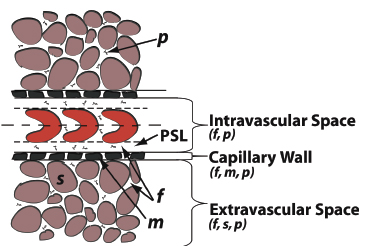
Figure 3: Normal and cancerous tissues can be divided into three regions: the intravascular space, vessel wall, and the extravascular space. The intravascular space consists of a core region containing the red blood cells (RBC) and the plasma skimming layer (PSL). The plasma skimming layer contains a fluid phase (f) and solute, herein a nanoparticle (n) or macromolecule. The capillary wall and tissue consists of fluid (f) and solid phases m or s) and solute (n). In cancerous tissue, defects in the capillary wall results in hyperpermeability and thus, increased solute transport.
Our current mixture theory formulation (27 nonlinear partial differential equations) includes a number of components not accounted for in the traditional transport equations. The hydraulic permeability coefficient of the capillary wall and the hydraulic conductivity of the tissue are necessarily dependent upon the concentration of solutes present. Also, the fluid flow in the interstitium was found to be related to both solute concentration and hydrostatic pressure. The mixture theory model also allows for the application of an external body force such as magnetic field gradient, uptake of solutes by cells, aggregation of the solutes, and solid tissue deformations.
Sensitivity Analysis and Modeling of Drug Efficacy
Perhaps the most important contribution to the ultimate clinical utility of our model is its integration with sensitivity analysis. These methods make it possible to determine which parameters are the most important to the prediction of drug delivery. We have since found that, while these parameters vary substantially from person to person, they can be quantified using a variety of medical imaging methods. These data ultimately led to the realization that we could determine the transport properties of the tumor with approximately 2 mm resolution using the contrast images that are part of the normal diagnostic process for many tumor types (Fig. 4). We are currently preparing to initiate a broad clinical study in order to determine whether or not the drug transport models ultimately predict treatment efficacy and, if so, can we use these data to design patient-specific protocols?
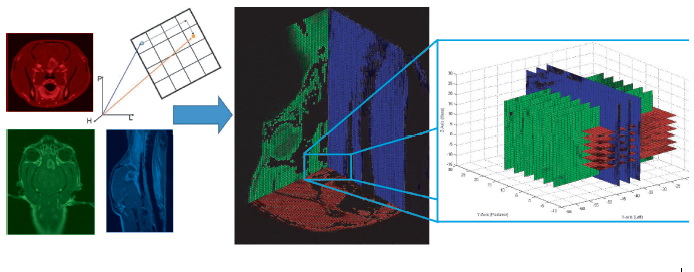
Figure 4: The determination of the concentration versus time for a point within a tumor was a five-dimensional problem. The five dimensions were the three cross sectional planes (axial, coronal and sagittal), time and concentration. Each plane represented a different scan time (left figure), with the axial scan (red) occurring before the coronal scan (green) and sagittal scan (blue). Note that each grayscale image has been modified to a specific RGB sequence for clarity. Each two-dimensional planar image (left figure) was placed into a three-dimensional coordinate system (middle figure). Once placed within the coordinate system, the tumor region was isolated and the intersection points of the three orthogonal planes were found (right figure). The intensities at the intersections were converted to contrast agent concentration and each planar concentration value was compared as a function of post-injection scan time.
These tools will be important to the clinical applications we hope to pursue at the University of Cincinnati.